
The Special Collections Spotlight Session for May featured some of the treasures of our collection of geographical publications. The session was presented as videos, which can be watched on our YouTube channel by clicking on the image below. There are four sections to the session, and the total runtime is about 25 minutes. Notes of the session follow below!
The closure of the library during lockdown had a few silver linings, including allowing us the space to audit some of the very large books in the collection. Many of these are books related to geography – maps, atlases, plans, and drawings. This month’s spotlight session highlights some of these.
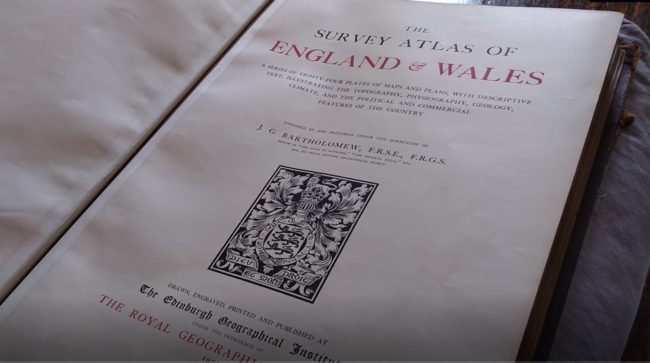
The first book examined is a traditional atlas, ‘The Survey Atlas of England and Wales’ from 1903 [Cb 36]. It was created under the auspices of John George Bartholomew of Edinburgh, who was born in 1860 and lived until 1920. He was one of the most renowned cartographers of the period, overseeing the rise to pre-eminence of his grandfather’s map-making business, John Bartholomew and Son Ltd. He even styled himself “Cartographer to the King”, after gaining a royal warrant! He was the co-founder of the Royal Scottish Geographical Society, and a member of the Royal Society of Edinburgh, the Royal Geographical Society, and the British Association for the Advancement of Science. He is also celebrated as the man who coined the name ‘Antarctica’ for the Southern continent, in 1890.
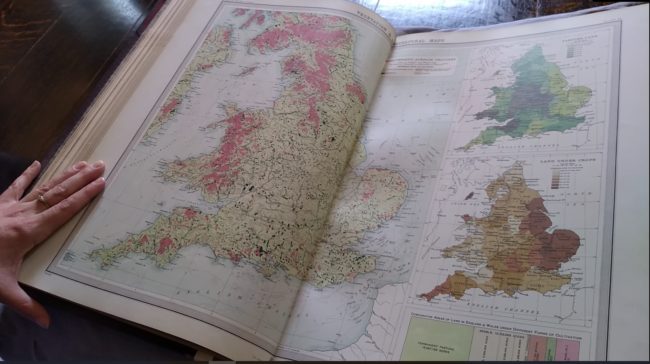
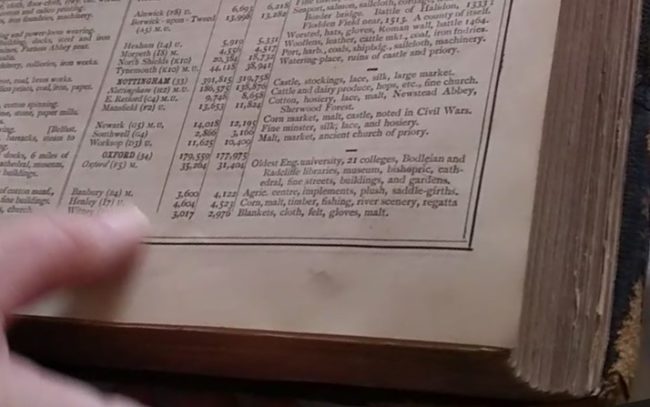
Cartographically, Bartholomew was innovative, introducing coloured contour layer maps, and recognising the importance of maps for everyday travel, ensuring that his publications included street plans, railways timetables, cycling routes and so on, as well as geographical features. This can certainly be seen in ‘The Survey Atlas of England and Wales’, which includes many of these details. The main feature is the colour plates showing the maps of England and Wales, but the book also includes a wealth of other information, such as population figures, weather data, demographics of the populace, religious data, and even common causes of death! Similar information can also be found in another of our holdings, ‘Atlas of the British Isles’ [Cb 34]. This one has an additional interest, though, as it includes a list of the principal towns of the kingdom, with notes of their salient features! This is great fun, and would make a good quiz for a future newsletter… The book itself is a bit of a mystery, however; our copy doesn’t have a title page so we don’t know who it was produced by, or when. The population figures in the tables are given for 1871 and 1881, though, so we can assume it was produced in the mid-late 1880s.
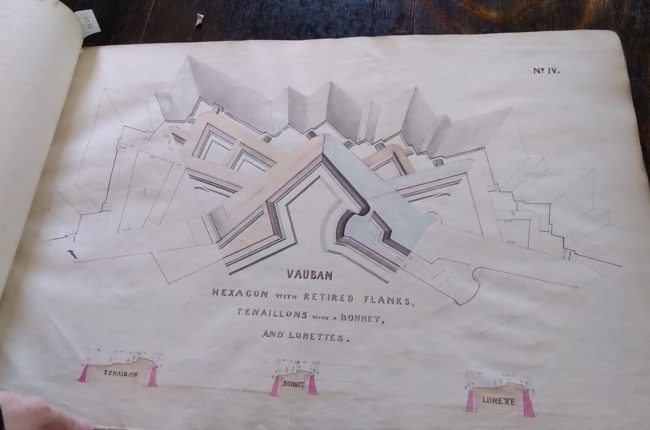
The next book highlighted in this session is another mystery. It’s a large, hand-drawn book by an unknown artist, from an unknown date; we’re not even sure exactly what its purpose is! It is very beautiful, though. The first part of the book comprises accurate scale drawings of systems of military fortification, as designed by Vauban. Sébastien le Prestre, Marquis de Vauban lived from 1633 to 1707, and was one of Europe’s most renowned military engineers. His principles for fortifications started from the assumption that any besieged fort or town would eventually fall, but the fortifications could be designed to tire and weaken the attacking forces, giving time for the defenders to be relieved by external reinforcements. Thus he advocated star-shaped bastion forts, including ‘sacrificial areas’ which could be abandoned by the defenders when they were taken, with troops falling back to secondary fortifications within the outer ones. These systems of defence are beautifully illustrated in this book, with one being sub-titled “as newly constructed by Vauban at Landau and Belfort”.
The following pages include examples of contour diagrams of geographical features, as well as tables of the commonly used symbols for military mapping. These culminate in a diagram of ‘The Road from Truxillo to Merida, surveyed 1st May 1809’. The diagram is accompanied by useful notes and comments. Mérida is in Spain, on the Guadiana river (which is also noted on the diagram). In 1809 Britain was involved in the Peninsular War, allied with Spain and Portugal against Napoleonic France, who had invaded and captured Spain, so this diagram is probably related to that conflict.
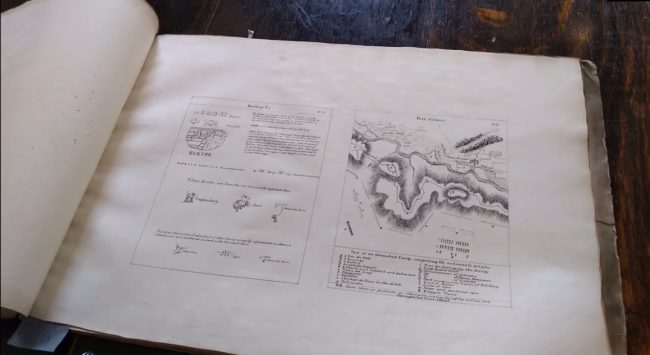
All the diagrams and notes in the book have been drawn by the same hand, so it is clearly the work of one person. The contents relate to different periods, however – for the defences at Landau to have been recently constructed ‘by Vauban’ the diagram must have originated in, or just shortly after, his lifetime. However, the Spanish map was surveyed over a century after Vauban’s death. It therefore seems likely that these drawings were copies of existing documents, brought together for some reason, possibly as a teaching aid, or indeed as exercises performed by someone who was learning military cartographic techniques. The book has no title page, just the name ‘Plans of Fortifications’ handwritten on one of the first leaves. Beneath this there is a message written very lightly in pencil, which seems to read “This book to be re[…] / Bromley House / […] 12th 1852”. That suggests that it was in the library by the 1850s, so was probably produced sometime in the early-mid 19th century.
A different method of recording a landscape on paper can be seen in the next two books. These are ‘panoramic drawings’ of views. A panorama is a drawing or painting of the full 360 degree view from one specific viewpoint. The term was coined by Robert Baker in the late 18th century; he presented a painted panorama of the city of Edinburgh, displayed around the interior of a specially built rotunda in London. The idea became very popular, as panoramas gave a three-dimensional sense of being in a place which the viewer might never see in real life. The drawings in our books are not strictly panoramas as they only show part of the full circular view from the artist’s viewpoint. They do provide a panorama-style image, though, being long drawings which show much more than a traditional viewpoint would do. ‘A panorama of the city of Funchal, in the island of Madeira: sketched on the spot’ [E 129] was drawn sometime in 1841-1843 by Mrs Emily Genévieve Smith, née Hanson Simpson. The artist was born in 1817 and lived to the age of 60, gaining a reputation as a draughtsperson. She married Rev. Reginald Southwell Smith of Stafford Rectory, Dorset in 1836, but in 1841 the couple moved to Madeira with their children in the hope of relieving Rev. Smith’s tuberculosis. They lived in Funchal, now Quinta da Nora, for two years, and on their return, Mrs Smith’s panorama was published. Our copy is the second edition, from 1844.

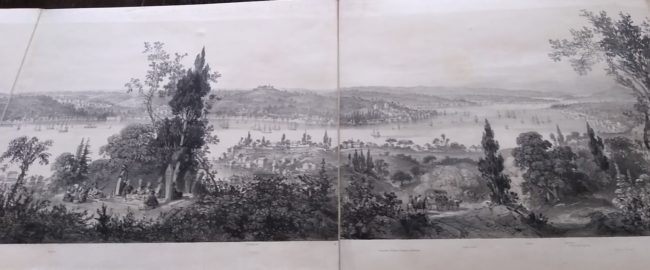
‘Panorama of Constantinople’ [E 124] is on an even grander scale than ‘…Funchal’! It contains two panoramic drawings, each of which folds out into an image five pages long; we actually don’t have a table large enough to fold out both sides of the book at once! The images are ‘Vue Générale du Bosphore de Constantinople a Roumeli-Hissari (prise d’Asie)’ and ‘Vue Générale du Bosphore de Roumeli-Hissarit a la Mer Noire (prise d’Asie)’. These translate as general views of the Bosphorus taken from Asia (so showing the European shore of the strait); the first shows the coast from Constantinople to Roumeli-Hissari, and the second shows the coast of Roumeli-Hissari in the Black Sea. They are marked as having been drawn from nature by J. Schranz and lithographed in Paris by Léon Baptiste Sabatier. The artist, Joseph Schranz, was born in Malta in 1803 and travelled widely around the Mediterranean, settling in Istanbul (then Constantinople) for some years in the 1850s. At that time there was a heightened interest in the city amongst people in Britain and France, due to the increased military presence from those countries in the Crimea, which is just across the Black Sea from Istanbul. Schranz’s panoramic drawings were published to appeal to that interest.
The final book examined during this spotlight session is an atlas of a very different kind: ‘The Stars, in six maps, on the gnomonic projection’ [Bb 85] was published around 1853, under the auspices of Sir John William Lubbock. Lubbock was a baronet from a banking family, head of Lubbock and Co. bank, but he was also a renowned mathematician and astronomer. He was a fellow of the Royal Society and the Royal Astronomical Society, and in 1829 he joined the Society for the Diffusion of Useful Knowledge. This organisation had been founded three years earlier to publish cheap textbooks of science and other subjects, intended for the use of those who didn’t have access to formal education, or who chose to pursue their own self-guided studies. The Society was active for 20 years, publishing many books of reference, including this astronomical atlas. As suggested by the title, the book contains six large maps showing the relative locations of the stars. It also has the various constellations picked out with coloured illustrations of the figures which they are said to represent. The image below shows the scorpion of constellation Scorpio.

The books highlighted here are all ‘for reference only’, so they cannot be borrowed but can be examined in the library.
Anja Thompson-Rohde